

Tariffs impact prices, businesses, and global trade, but how do they really work, and why do they matter now? Take a step back into the classroom with us for a refresher on these powerful and sometimes controversial trade tools.
Tariffs are taxes countries place on imported goods or services to protect domestic industries, generate revenue, and, in some cases, gain political leverage. Nearly every country in the world uses tariffs to some degree, making it essential to understand these forces that shape global trade.
Given all the attention on tariffs these days, we thought it might be time a brief refresher on tariff theory 101 and a real-world example from the U.S.-China whole soybean market.
Tariffs in Theory
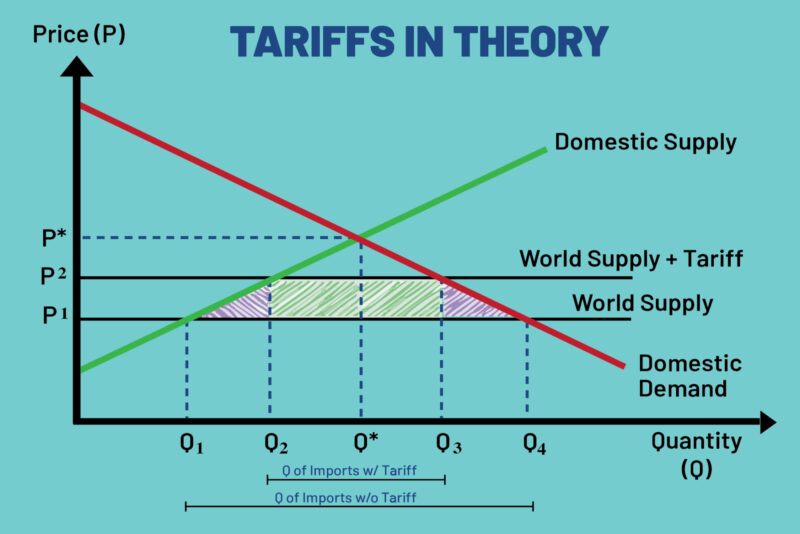
If you’ve ever taken an intro to economics class, then you’ll likely be familiar with the chart above. This is an idealized illustration of a tariff’s effect on the supply and demand for a good. For our purposes, let’s say the good in question is rubber ducks. The green upward sloping line represents domestic supply, and the red downward sloping line domestic demand. Their intersection at P* and Q* marks the equilibrium price and quantity for rubber ducks without trade. However, few countries operate under autarky (meaning they are completely self-sufficient and economically independent). Most use trade to access a wider range of goods and services than domestic production alone can provide.
In this example, the world’s supply curve is the lower of the two horizontal lines. The advantages of tapping into world supply become clear when looking at the new price and quantity, P1 and Q4 respectively, both of which are more favorable to the consumer than those under pure autarky: there are more available rubber ducks at a lower price (P1<P* & Q4>Q*). However, you may also notice that domestic suppliers are, theoretically, hurt by world trade. After all, under autarky they were able to command a higher price while selling more rubber ducks (Q1<Q* & P1<P*).
If selling rubber ducks at the new world trade price (P1) becomes unsustainable for domestic suppliers, they may ask their government to impose a tariff on imports. The protective tariff the country puts on the imported ducks is represented by the second, higher horizontal line. This pushes the price up (P2) and allows domestic suppliers to sell more (Q2) than they could previously (P2>P1 & Q2>Q1). On the other hand, it can hurt consumers and global suppliers, as the former must now pay a higher price (P2) and the latter is selling fewer goods than they were under free trade (Q3<Q4).
Additionally, the country implementing the tariff does realize some income, as represented by the green shaded rectangle. However, this income comes at a theoretical cost, typically referred to as deadweight loss, represented by the two shaded purple triangles. Deadweight loss is the societal loss created by the tariff: the supply of rubber ducks (Q3) is lower than it would be in a free market, meaning there are consumers who aren’t buying rubber ducks who would have under the lower price (P1) of free trade.
Of course, this wouldn’t be economics if there weren’t several caveats to this idealized model, but we will not dig too deeply into them here. We will also not be delving into the incidence of the tariff (i.e. who the burden of the tariff falls on, buyer vs seller) nor will we be discussing the political dimension of tariffs. Nonetheless, this model provides a solid approximation of tariffs’ real-world effects.
Tariffs in Practice
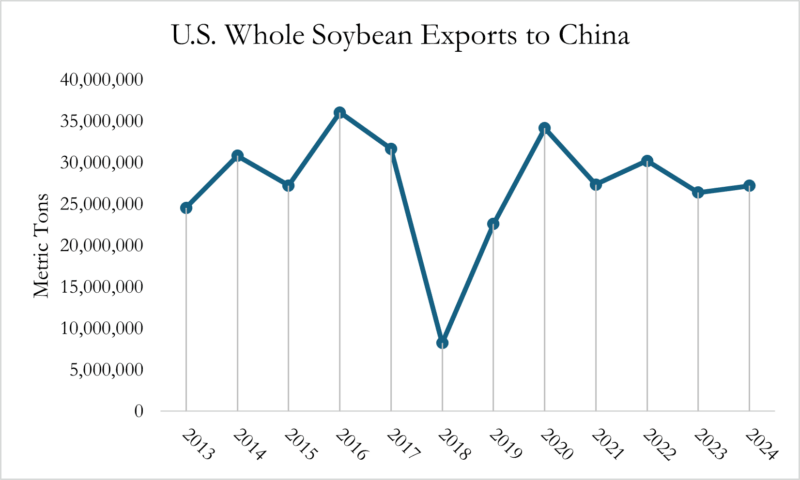
Let’s turn our attention back to the real world and the U.S.-China soybean market. Used primarily in animal feeds, whole soybeans consistently rank as the U.S.’ top agricultural export, making it both an economic boon to the country as well as a potential target for retaliation.
In 2018, U.S.-China relations soured as the opening salvos of a trade war sounded across the pacific. One of the results was a 25 percent tariff on whole soybeans entering China from the U.S. As might be expected, this resulted in a cratering of U.S. soybean exports to China as U.S. soybeans became markedly more expensive relative to their competitors in the space.
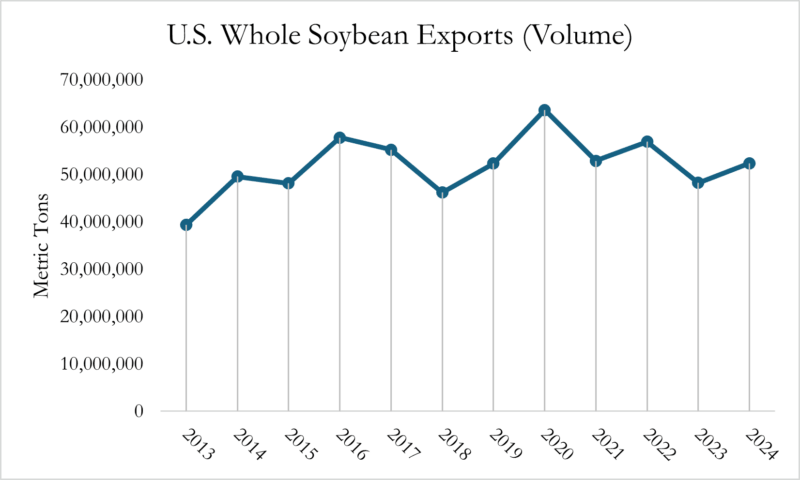
Though the U.S.-China soybean trade recovered in the years that followed 2018, it never quite reached the heights it had prior to the disruption. The U.S., for its part, shifted its export ambitions elsewhere, and China substituted U.S. soy for with Brazilian and Argentinian equivalents. With U.S.-China tensions flaring again in the first half of 2025, we can expect to see a similar trend of substitution.
Another more understated form of tariff is the tariff rate quota (TRQ), which allows a set amount of goods to enter a country under a lower tariff. After this set amount is met, however, a higher tariff rate applies, allowing for some middle ground between unfettered trade and protectionism. Some examples include South Korea’s use of TRQs to balance the prices of agricultural imports or Canada’s dairy TRQ, which it uses to shelter the Canadian dairy industry from what would likely be an industry-killing number of American imports.
Ultimately, tariffs are a tool, and their effectiveness will vary depending on how and when they are used. We hope that this brief refresher is a valuable grounding in how this tool works, where it’s been used in the past, and how it might impact the future. If you’re interested in tracking tariffs applicable to you or your competitors, Bryant Christie Inc. can help you navigate this ever-shifting landscape.